
In this article, we will discuss the indifference curve analysis. After reading this article you will learn about:
- Assumptions of Indifference Curve
- What Is the Indifference Curve?
- What is the Marginal Rate of Substitution?
- Properties of the Indifference Curve
The Indifference curve (IC) analysis belongs to the ordinal utility approach. Pioneers of this approach are,
- Edgeworth
- Fisher
- Slutsky
- Hicks
- Allen.
In this approach, we do not measure utility. But we rank in the order of utility derived from them.
Assumptions of Indifference Curve Analysis
First of all, let us understand the assumptions of IC analysis. What are the assumptions of indifference curve analysis? Let’s see.
- Rationality
- Utility is ordinal
- The diminishing marginal rate of substitution
- Total utility of the consumer depends on the amount of the commodities consumed
- Consistency and transitivity of choice
- The goods consumed by the consumer are divisible and are substitutable to each other
- An individual’s preferences are such that he prefers more to less.
Let us understand the assumptions.
1. Rationality.
The consumer assumes to be rational. So the consumer aims to maximize utility by consuming commodities, given his income and prices of goods.
Further, this assumption shows that consumers know all relevant information on the market. Those are other goods available in the market, their prices, and their income.
2. Utility is ordinal.
The utility is ordinal means that consumers can rank or order the various baskets of commodities based on each basket’s satisfaction or utility.
The consumer does not need to know correctly the amount of utility he gets as in the cardinal approach. Hence, it does not need to measure the utility levels cardinal.
What the consumer needs to do is to express his preference over the various bundles of commodities ordinally.
For example, whether X>Y or Y>X or X=Y, etc., where A and B are any two commodities or baskets of commodities.
3. The diminishing marginal rate of substitution.
Indifference curve analysis is based on the axiom of diminishing marginal rate of substitution. Suppose that a consumer consumes two commodities, say X and Y. From a combination of the commodities, he gets a certain level of utility or satisfaction.
If he decided to cut down the quantity of one commodity and keep the utility level unchanged, he should substitute some units from the other commodity.
For example,
There are two commodities, say X and Y. If the consumer decided to cut down the quantity of X commodity and keep the utility level unchanged, he should substitute some units from the Y commodity.
Suppose that the consumer cut down Delta Y unit of commodity Y, and he substituted Delta X of X. The ratio of these two quantities Delta Y/ Delta X is called the marginal rate of substitution (MRS).
It is the ratio of the units omitted from commodity Y and the amount of units substituted from commodity X.
In this analysis, assume that this ratio is diminishing.
4. The total utility of the consumer depends on the quantities of the commodities consumed.
5. Consistency and transitivity of choice.
It is assumed that the consumer is consistent in his choice. For example, if there are two alternative bundles of commodities, say A and B, the consumer must choose.
A is preferred to B A > B
B is preferred to A B > A
A and B are equally preferred
The consumer is not in the state of indecision. Moreover, if in one period he said A > B, he will not say B > A in another period if both bundles are available.
Transitivity assumption means that the consumer’s preferences are not self-contradictory. This means that if the consumer said that
A is preferred over B
B is preferred over C then
A is preferred over C.
Symbolically this assumption can be written as follows:
If A > B, and B > C, then A > C
6. The goods consumed by the consumer are divisible and are substitutable to each other.
7. An individual’s preferences are such that he prefers more to less.
Keeping the consumption of other commodities constant and increasing the consumption of at least one commodity is better.
Indifference Curve Definition
Secondly, we discuss the definition. So what is the indifference curve? Let’s see.
An indifference curve is one of the main tools, which used in this analysis to examine consumer behavior and to derive the low of demand.
An Indifference curve shows,
The various commodity combinations which give the same level of satisfaction.
It can illustrate as an algebraic equation or as a schedule or as a graph. We can mark various combinations of commodities that give a different level of satisfaction to the consumer in a two-dimensional plane. In the two axes, shows two commodities.
There are commodity combinations that give the same level of satisfaction, even if the commodity combination difference. By joining these commodity combinations, we can form an indifference curve.
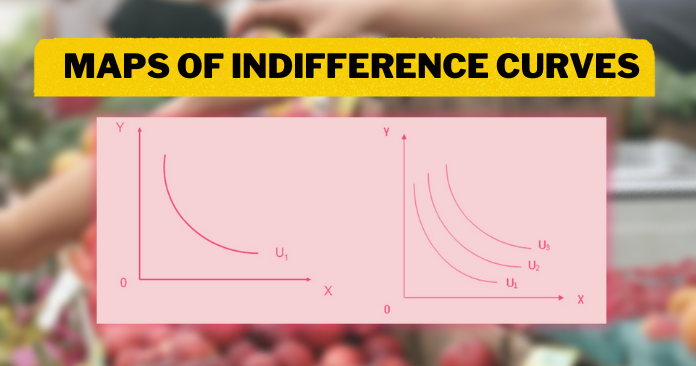
The map includes several indifference curves called ‘The map of indifference curves’. It shows the ranked preference of the consumer. Combinations of commodities lying on a higher indifference curve yield a higher level of satisfaction than the lower indifference curves.
According to the consumer preference U1<U2<U3
Among these various combinations, we can identify certain commodity combinations or bundles of goods, which yield the same level of utility or satisfaction. The locus of these points of commodities generates the IC, graphically.
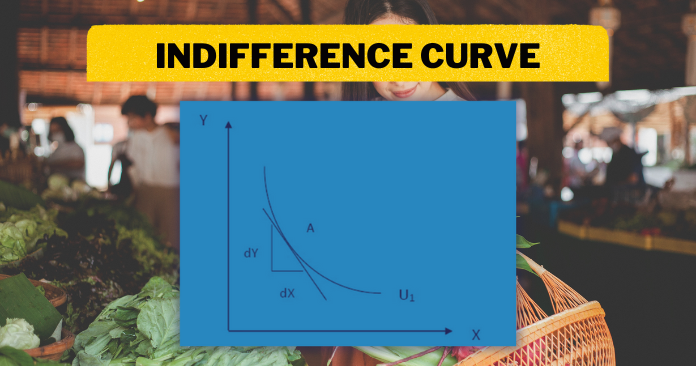
So Indifference curve can define as,
The locus of different combinations of two or more commodities yields the same level of satisfaction or utility.
However, it is also called as ‘iso-utility curve‘.
Indifference Curve and Marginal Rate of Substitution
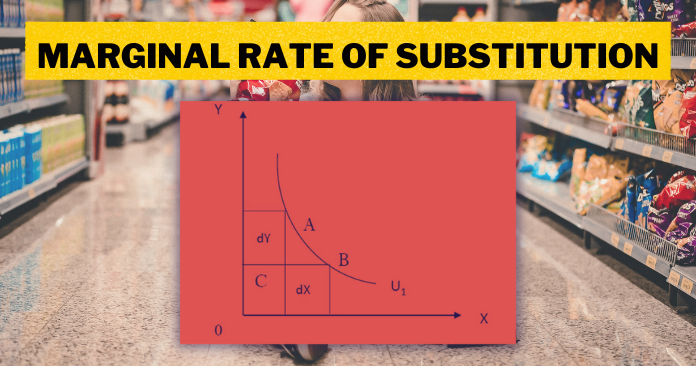
When the consumer moves along the curve U1 from left to right, say from point A to point B, commodity combination change but not the utility level.
Point A,
Lost of satisfaction due to cutting down dY of Y = △Y×MUy
Lost of satisfaction due to cutting down dY of X = △X×MUx
Since the utility levels are the same on both A and B, these two must be equal.
△Y×MUy = △X×MUx
By rearranging this equation
△Y/△X = MUx/MUy = MRSxy
Hence, MRS, X for Y is defined as
- The number of commodity Y units must be given up in exchange for an extra unit of X so that the consumer maintains the same level of satisfaction.
- The slope of the indifference curve shows the MRSxy. The slope of any point of a certain indifference curve equals to the slope of the tangent drawn to that point.
Properties of the Indifference Curves
- An indifference curve has a negative slope.
- The indifference curve of a rational consumer is convex towards the origin.
- Indifference curves cannot intersect with each other.
1. An indifference curve has a negative slope.
For a rational consumer, when the quantity of one commodity increases, the quantity of other commodities must decrease in order to stay on the same level of satisfaction. To satisfy this condition, the IC must be negatively sloped.
It cannot take other alternative shapes such as a positive slope or parallel to the vertical axis or parallel to the horizontal axis. This is because those shapes do not satisfy the above condition.
2. Indifference curve of a rational consumer is convex towards the origin.
This shows that the slope of the IC decreases as we move along the curve from the left to the right. As explained above, the slope of the indifference curve equal to the MRS. And also assumed that it is diminishing. Therefore the indifference curve is convex towards the origin.
The curve of the IC depends on the substitutability between goods.
If the goods are perfect substitutes for each other, the indifference curve will be a straight line sloping downward.
MRS of this shape of the indifference curves is constant. The indifference curve touches the commodity axis means that the utility level indicated by the indifference curve can attain by consuming one commodity alone keeping the quantity of another commodity at the zero levels.
If the goods are complementary indifference curve will be in the shape of a right angle.
If two goods are complementary, they are required in fixed proportions to attain the given level of satisfaction. The minimum required proportion of the goods will be shown by a point through which the indifference curve will pass. In such a situation the IC will be in the shape of a right angle at the point that shows the minimum proportion of the two goods. MRS will be zero in this case.
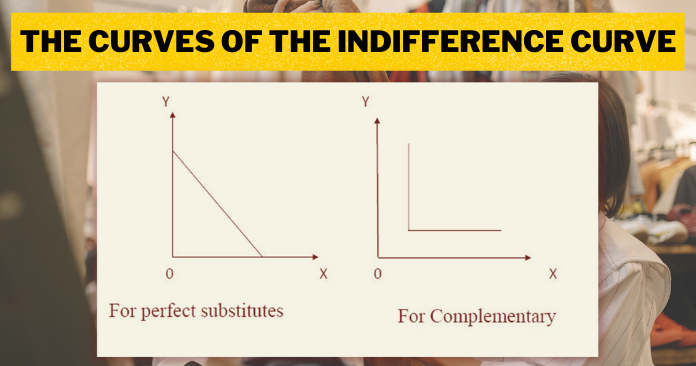
complementary – shape of a right angle
Greater the curvature of the indifference curve, lesser will be the degree of substitutability. Thereby shows low MRS. On the other hand, if the shape is less, the degree of substitutability is quite high.
3. Indifference curves cannot intersect each other.
This is because if it happened, the point of intersection would suggest two different levels of satisfaction. It is impossible.
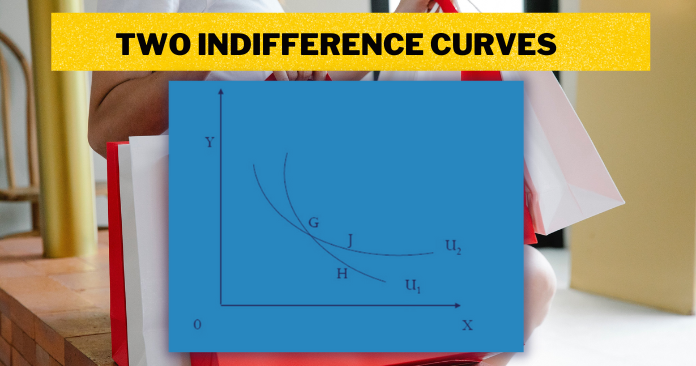
G and H are two points on indifference curve U1, which yield equal satisfaction. Therefore, the consumer is indifferent over these two bundles of commodities. On the other hand, G and J are two points on the indifference curve U2, which yield equal satisfaction.
According to the transitivity assumption,
G=H
G=J
So, H=J
But, U2>U1 So, J>H
So, Indifference curves cannot intersect with each other.
Did I miss anything?
Questions
1. What is an indifference curve?
2. What are the assumptions of the IC?
3. What are the properties of IC?
4. Compare and contrast the marginal utility approach with indifference curve analysis of consumer behavior based on their assumptions
5. Define IC. How it is derived.
6. Explain the Marginal Rate of Substitution.
7. What happens to MRS as you move along a convex IC?
I think the answers to these questions can found in this article. If there is any problem, leave a comment. I’m here to support you.
Conclusion
All right then. In this article, we discussed the definition, assumptions, and properties of the indifference curve. And also, we learned about What is the Marginal Rate of Substitution?. So did I miss anything? Let me know by leaving a comment below right now.
Further Reading
Consumer equilibrium and indifference curve analysis
Consumer equilibrium and utility analysis
What is Indifference Curve: Definition, Assumptions, Properties
Isoquant curve analysis of production in economics
Indifference Curve Questions and Answers
What is a Budget Line| Definition, Properties, Equation